This is a Guest Post by Dr. Arnout ter Schure on Twitter
What is the VIX/VXV ratio telling us about the state of the stock markets?
VIX/VXV 비율이 우리에게 주식 시장의 상태에 대해 말해주는 것이 무엇인가???
The VIX:VXV ratio has been dropping from almost 1.05 in June to today’s low reading of 0.83. What does this ratio mean and why should we care? To answer the first question. Everybody knows the VIX. It is the volatility index, which measures one-month implied volatility. The VXV ratio, however, is lesser known and measures the 3-month implied volatility.
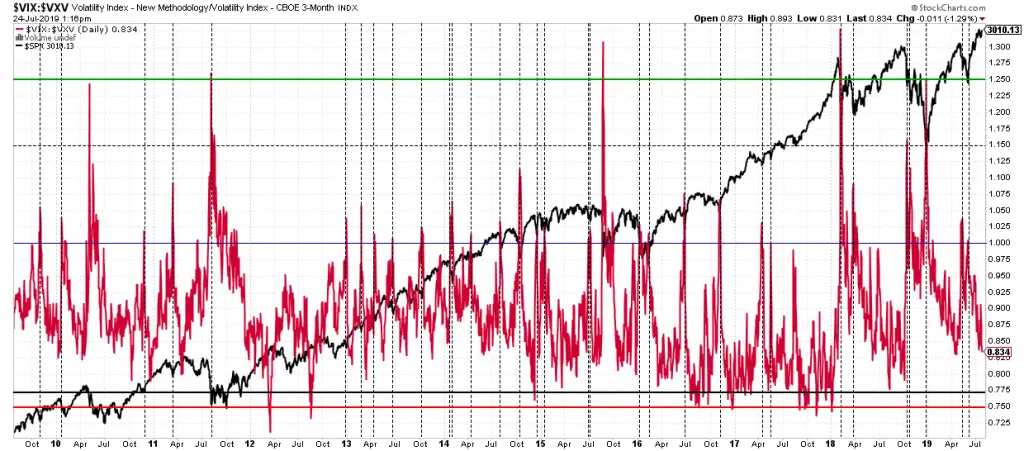
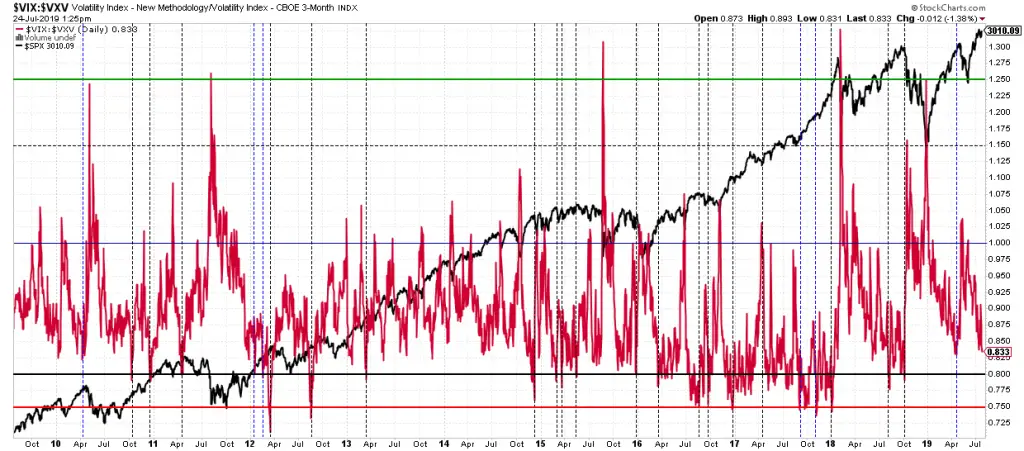
It therefore tends to be less volatile than the VIX. The ratio between the two tells us if expected near term volatility exceeds longer term expected volatility and vice versa. Hence a high ratio (>1.25) (녹색선)means a high current volatility, but expected lower volatility 3 months out, whereas a low ratio (<0.80) means traders and investors expect very little to worry about now but a lot more 3 months out. These extreme high and low readings often coincide with bottoms and tops, respectively (see Figures 1 and 2 below).
VIX:VXV 비율은 6월의 거의 1.05에서 오늘의 최저치인 0.83으로 떨어지고 있다. 이 비율은 무엇을 의미하며 왜 우리가 관심을 가져야 하는가? 첫 번째 질문에 답하기 위해서. VIX는 누구나 알고 있다. 그것은 변동성 지수로서, 1개월간의 암시적 변동성을 측정한다. 그러나 VXV 비율은 덜 알려져 있고 3개월 암시적 변동성을 측정한다.
따라서 VIX보다 변동성이 떨어지는 경향이 있다. 둘 사이의 비율은 기대근기 변동성이 장기기대 변동성을 초과하는지 그리고 그 반대인지 여부를 알려준다. 따라서 높은 비율(>1.25)은 현재 변동성이 높지만 변동성이 3개월 후에 낮아질 것으로 예상하는 반면, 낮은 비율(<0.80)은 거래자와 투자자들이 현재 걱정할 것은 거의 없고 앞으로 3개월은 훨씬 더 걸릴 것으로 예상한다는 것을 의미한다. 이러한 극단적인 높은 판독치와 낮은 판독치는 각각 하단과 상단과 일치한다(아래의 그림 1과 2 참조).
FIGURE 1: HIGH VIX:VXV ratio
그림 1: 높은 VIX:VXV 비율

High ratios identify bottoms more easily because bottoms are always a short-term affair: a bottom is put in on a day, followed by a spike higher over the next few trading sessions(기간). So very high VIX/VXV ratios (>1.25) are easy additional information to confirm a meaningful bottom is being put into place(제자리에 갖다 놓다:적용되고 있다)
.
높은 비율은 하한은 항상 단기적인 일이기 때문에 더 쉽게 바닥을 식별한다. 즉, 하한은 하루에 투입되고 다음 몇 번의 거래에서 더 높은 상승이 뒤따른다. 따라서 매우 높은 VIX/VXV 비율(>1.25)은 의미 있는 하단이 적용되고 있음을 확인하는 쉬운 추가 정보다.
FIGURE 2: LOW VIX:VXV ratio

Tops on the other hand take time to develop and complacency can stay rampant(맹렬한) much longer than you can stay rational or solvent(용해력이 있는). So low readings are not as reliable, but still very useful. Today’s low reading warrants further monitoring as it is getting close to the recent mid-April readings, and the market then topped within two weeks before dropping in May well-below the price it was printing back(자국을 내다) in April. Albeit price is now higher than in April, such corrections may warrant(보장하다) for many to either have protection in place, such as inverse ETFs (SPXU, SDS, SH), buy put options, etc. Or to simply move into a cash position.
탑스는 개발하는 데 시간이 걸리고 만족감은 합리적인 것 또는 용제를 유지할 수 있는 것보다 훨씬 오래 머무를 수 있습니다. 따라서 낮은 판독 값은 신뢰할 수는 없지만 여전히 유용합니다. 오늘의 낮은 독서는 최근 4 월 중순의 수치에 가까워지면서 추가 모니터링이 필요하다는 것을 의미하며, 시장은 4 월에 다시 인쇄되는 가격보다 5 월에 떨어지기 전에 2 주 이내에 정상에 올랐습니다. 가격이 4 월에 비해 높아 졌음에도 불구하고, 그러한 수정은 인버스 ETF (SPXU, SDS, SH), 풋 옵션 구매 등과 같이 많은 사람들에게 보호 조치가 취하게 하거나 현금 포지션으로 이동하는 조치하도록 보장한다
.
Obviously, readings below 0.80 and especially VIX:VXV ratios below 0.75 are more indicative(표시하는) of a pending top than readings above these cut off levels. But, as the chart shows in 2016 through 2017 the ratio dipped below 0.80 and even below 0.75 frequently, while the markets simple kept rallying. Up until January 2018 that is. That was the last <0.75 reading and if you’d have ignored it the subsequent decline would likely have been very painful. Just like several others:
분명히 판독값이 0.80 미만이고 특히 VIX:0.75 미만의 VXV 비율은 이러한 차단 수준 이상의 판독값보다 보류 중인 상단의 표시이다. 그러나 2016~2017년 도표에서 알 수 있듯이 이 비율은 0.80 미만으로, 심지어 0.75 미만으로 떨어진 반면, 시장은 단순하게 상승세를 지속했다. 2018년 1월까지는 그랬다. 그것이 마지막 <0.75 독해>였고 만약 당신이 그것을 무시했더라면 그 이후의 하락은 매우 고통스러웠을 것이다. 다른 여러 사람들과 마찬가지로:
- March 2012: The market dropped within 4 days to below the price the VIX:VXV signal was given, then rallied to a marginal higher high the next few days, only to correct much more into the June 2012 low.
- August 2012: The market corrected the next 2 weeks to below the price at which the VIX:VXV signal was given, then rallied for new highs the following month, only to correct much more into the November 2012 low.
- August 2016: The market had topped and declined into its November low.
- December 2016: The market had topped, corrected into its late-December low and then rallied.
2012년 3월: 시장은 4일 이내에 하락하여 VIX의 가격 이하로 떨어졌다.VXV 신호가 전달된 후, 다음 며칠 동안 한계치(최저한의) 높이로 상승했지만, 2012년 6월 최저치로 훨씬 더 많은 것을 수정했다.
2012년 8월: 시장은 다음 2주를 VIX가 제시한 가격 이하로 수정했다.VXV 신호가 전달된 후 다음 달에 다시 최고치로 상승했지만, 2012년 11월 최저치로 훨씬 더 많이 회복되었다.
2016년 8월: 그 시장은 최고수준으로 올랐다가 11월의 최저치로 하락했다.
2016년 12월: 시장은 최고치로 상승했다 12월 하순에 최저치로 수정되었고 나서 회복되었다
Hence, albeit a small “n” (but that’s simple because it’s a rare signal), all lead to corrections some of which much larger than most traders and investors can stomach and sit through(끝날 때까지 가만히 있다) as price eventually moves well-below levels from which the signal was given.
그러므로 비록에 작은 n이자만,(흔한 표시가 아니기에 단순하지만) 모든 것이 수정으로 이끌었는데 가격이 마침내는 사인이 주어진 것으로부터 낮은 수준으로 이동할 때 그 중 얼마는 대부분의 거래자와 투자자들이 소화해낼 수 있고 끝까지 기다릴 수 있는 것 보다 큰 량이었다
So as this ratio is approaching the 0.80 levels it is likely time to get a bit more cautious. But, as with everything else when analyzing the markets, please don’t use anything in isolation. Add this ratio to your toolbox, track it to see if the signals it is given align(일직선으로 세우다) with other indicators, etc. In the end all your tools will help you assess what the next larger move in the markets most likely will be. It is rare all tools will align, so use a weight of the evidence approach.
그래서 이 비율이 0.80에 가까워지고 있기 때문에 좀 더 신중해질 때가 될 것 같다. 그러나, 시장을 분석할 때 다른 모든 것과 마찬가지로, 아무것도 따로 사용하지 마십시오. 툴 박스에 이 비율을 추가하고, 툴 박스에 주어진 신호가 다른 표시기와 정렬(일직선으로 세우다)되는지 여부 등을 추적하시오 . 결국 당신의 모든 도구는 당신이 가장 가능성이 높은 시장에서 다음 번 더 큰 움직임을 평가하는데 도움을 줄 것이다. 모든 공구가 정렬되는 경우는 드물기 때문에 증거 접근법의 가중치를 사용하십시오 .
Arnout ter Schure, Ph.D.
'거래정보' 카테고리의 다른 글
| 125 (0) | 2019.07.29 |
|---|---|
| Two Things Successful Traders Are Doing(성공적인 트레이더들이 하고 있는 두 가지 일) (0) | 2019.07.27 |
| 여기에 누군가의 의견이나 예측 대신 가격 거래에 착수할 수 있는 5가지 기본 기술 지표가 있다. (0) | 2019.07.26 |
| The Three Skills of Top Trading:(최고 거래의 세 가지 기술:) (0) | 2019.07.25 |
| The Differences Between Pain and Fear in Trading(거래에서의 고통과 두려움의 차이) (0) | 2019.07.24 |