What Causes an Ascending Triangle Pattern?(Ascending triangle 패턴의 원인이 되는 것은?)

Chart Facts:
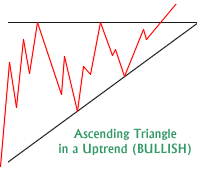
- The ascending triangle is a bullish chart pattern that usually forms during an uptrend as a continuation pattern.상승 삼각형은 상승하는 동안 연속적인 패턴으로 형성되는 강세 차트 패턴이다.
- Sometimes an ascending triangle pattern will form as a reversal pattern as a downtrend comes to an end, but they are usually continuation patterns in an uptrend.
가끔 상승하는 삼각형 패턴은 하강 추세가 끝나면서 반전 패턴으로 형성되지만, 대개 상승 패턴에서 연속 패턴이 된다.
- Regardless of their location during a trend ascending triangles are bullish patterns that indicate accumulation. The higher lows in the pattern are a clue that sellers are not letting their position go(작동하다) at lower prices as the pattern makes higher lows.
추세 동안의 위치에 관계없이 오름차순 삼각형은 누적을 나타내는 강세 패턴입니다. 패턴의 최저가가 높다는 것은 패턴이 높은 최저치를 만들면서 판매자가 자신의 포지션을 더 낮은 가격에서 작동하지 못하게하는 단서입니다.
- The top horizontal resistance line on this pattern holds until the sellers are worked through(일을 이루고) and buyers come in at higher prices, this signals a buy signal for the potential breakout(잠재적인 이탈) to higher prices and the continuation or the beginning of an uptrend.
이 패턴의 상단 수평 저항선은 셀러가 작업을 하고 구매자가 더 높은 가격으로 들어올 때까지 유지되며, 이는 더 높은 가격에 대한 잠재적 이탈과 지속적인 또는 상승의 시작에 대한 구매 신호로 이어진다.
Ascending triangle patterns can be longer in timeframe and wider in range than a flag(삼각깃발) or a pennant(페넌트). The length of this pattern can range from a few weeks to months with the average lasting for 1-3 months. Many times the catalyst of earnings will trigger a breakout for a stock.
확장 삼각형 패턴은 깃발이나 페넌트보다 시간적으로 더 길고 범위가 더 넓을 수 있다. 이 패턴의 길이는 몇 주에서 몇 달 사이이고 평균은 1-3개월 동안 지속될 수 있다. 많은 경우 수익의 촉매는 주식의 이탈을 촉발할 것이다.
- Many times volume will contract as the pattern gets near to a breakout. A breakout with higher than average volume can give a higher rate of success for a buy signal.
패턴이 브레이크아웃에 가까워질수록 볼륨이 수축되는 경우가 많다. 평균보다 높은 볼륨의 브레이크아웃은 구매 신호의 성공률을 높일 수 있다.
Many times a return to the breakout price level will happen as old resistance becomes new support for a second chance entry.
기존의 저항이 두 번째 기회 진입에 대한 새로운 지원이 되면서 이탈 가격 수준으로 복귀하는 경우가 많다
- Traditionally the price projection(예측) for this pattern after the breakout is found by measuring the longest distance in the price range of the pattern and projecting 예측하다 비추다)after the resistance breakout.
전통적으로 이 패턴에 대한 가격 예측은 패턴의 가격 범위 내에서 가장 긴 거리를 측정하고 저항이탈 후 투영한다.
The below $XES chart shows the horizontal trend line that lasted 6 months around the $16.50 area and the ascending trend line of higher lows that started in the middle of August. The large candlestick bullish breakout over resistance carried through for a run to $18 and could go farther. This chart trend could be from the breakout of $16.50 to $20.50 equal for a $4 trend equivalent to the longest range of the triangle from $12 support low to resistance at $16.50.
아래의 $ XES 차트는 $ 16.50 지역에서 6 개월간 지속 된 수평 추세선과 8 월 중순에 시작된 고점의 상승 추세선을 보여줍니다. 저항을 넘어선 큰 촛대 강세는 18 달러에 이르렀으며 더 멀리 갈 수 있었습니다. 이 차트 추세는 $ 16.50에서 $ 20.50 사이의 돌파구에서 $ 12지지에서 낮은 저항까지 $ 16.50에서 삼각형의 가장 긴 범위에 해당하는 $ 4 추세와 같습니다.

Chart Courtesy of StockCharts.com
'거래정보' 카테고리의 다른 글
| What is Technical Analysis?(기술 분석이란?) (0) | 2019.08.16 |
|---|---|
| Jesse Livermore’s 10 Key Principles:(제시 리버모어의 10가지 주요 원칙:) (0) | 2019.08.15 |
| Calm Trader, Rich Trader:(침착한 트레이더, 리치 트레이더:) (0) | 2019.08.15 |
| Why Moving Averages are the Best Trend Indicator(이동 Average가 최고의 추세 지표인 이유) (0) | 2019.08.14 |
| Trading for a Living(생활을 위한 거래) (0) | 2019.08.14 |