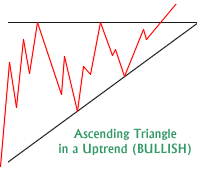
How to Draw Support and Resistance Lines(지지선 및 저항선 그리기 방법)
Trend lines are the identifiers and connectors of resistance and support in chart patterns.
Trend lines are ways to measure and quantify the path of least resistance for a chart in your time frame.
Trend lines are identifiers of the trend in your trading time frame.
Vertical trend lines must be drawn from left to right to identify one of the following:
트렌드 라인은 차트 패턴에서 저항과 지지의 식별자들 및 접촉자들이다.
트렌드 라인은 시간 프레임에서 차트에 대한 최소 저항의 경로를 측정하고 정량화하는 방법이다.
트렌드 라인은 당신의 거래 시간대의 추세의 식별자들이다
다음 중 하나를 식별하려면 수직 추세선을 왼쪽에서 오른쪽으로 그려야 한다.
A trend of higher highs signaling an uptrend.
A trend of higher lows for support in an uptrend.
A trend of lower lows signaling a downtrend.
A trend of lower highs for resistance in a downtrend.
상향 추세를 나타내는 높은 최고점의 추세
상승 추세에서 뒷받침을 위한 높은 저점 추세입니다.
하락 추세를 나타내는 낮은 저점의 추세입니다.
하락 추세에서 저항에 대한 낮은 최고점의 추세
Horizontal trend lines must be drawn straight from left to right to identify price levels of resistance based on repeating high prices that can’t be broken or levels of support based on repeating lows that hold.
Trend lines can connect end of day prices or the full daily range of prices. For candlestick charts the wicks(심지) represent intra-day prices that were outside the open or the close. Both are viable options for trend lines.
Trend lines should connect at least two price levels in a direct path to be considered viable. The more connections that a trend line makes the more meaningful it is.
Trend lines must be updated daily to ensure a trend is still in place. You want to see a connection(연관성) and trend of prices in your timeframe.
A break out of price through your connecting trend line can indicate the beginning of a change in trend or market environment. A market could be going from an uptrend or downtrend to a sideways range as your trend line breaks or reversing in trend completely.
The vertical red lines on this chart represents the two downtrends that $XLE went through (경험하다)for weeks making lower highs day after day for much of the downtrend.
The green lines on the $XLE chart represent vertical support of higher lows as $XLE trends up twice on this chart. Notice that the red downtrend line was broken both times before the next uptrend began.
수평 트렌드 라인은 깨질 수 없는 고가의 반복적인 가격이나 보유하는 저가의 반복을 바탕으로 저항의 가격 수준을 파악하기 위해 왼쪽에서 오른쪽으로 직선으로 그려야 한다.
트렌드 라인은 일일 가격 또는 전체 일일 가격 범위를 연결할 수 있다. 촛대 차트의 경우, 심지들은 오픈 또는 마감 이외의 일일 가격을 나타낸다. 두 가지 모두 트렌드 라인에 대한 실행 가능한 옵션이다.
트렌드 라인은 실행 가능한 것으로 간주하기 위해 적어도 두 가지 가격 수준을 직접적인 경로로 연결해야 한다 트렌드 라인이 연결될수록 의미가 크다.
트렌드 라인은 트렌드가 계속 유지되도록 매일 업데이트해야 한다. 당신은 당신의 기간 내에 가격추세와 연관성을 보고 싶어한다.
당신의 연결 추세선을 통한 가격 이탈은 추세나 시장 환경의 변화의 시작을 나타낼 수 있다. 당신의 트렌드 라인이 완전히 깨지거나 역행함에 따라 시장은 상승세 또는 하강세에서 측면 범위로 바뀔 수 있다.
이 차트의 수직적인 빨간색 선은 추세의 대부분에 대해 매일 낮은 최고치를 만들면서 . $XLE 가 몇 주 동안 경험했던 두 가지 하락추세선을 나타냅니다
$XLE 차트의 녹색 선은 이 차트에서 $XLE 추세가 두 번 상승함에 따라 더 높은 저하의 수직적 지지를 나타낸다. 다음 업트렌드가 시작되기 전에 빨간색 다운렌드 라인이 두 번 모두 고장 났다는 것을 알아두십시오.
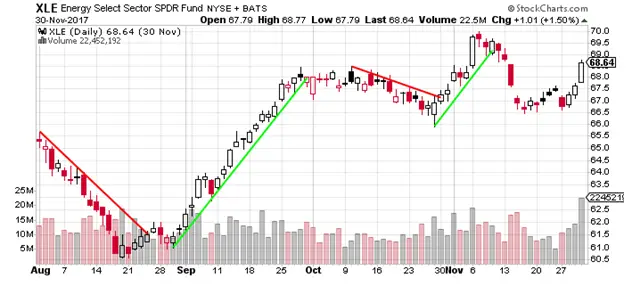
Chart courtesy of StockCharts.com
Chart Summary: Trend lines are visual ways to measure, identify, and track the trends on a chart by connecting vertical or horizontal support and resistance on a chart.
Price channels can be: up, down, or sideways.
There are uptrend, downtrend, and range bound price channels.
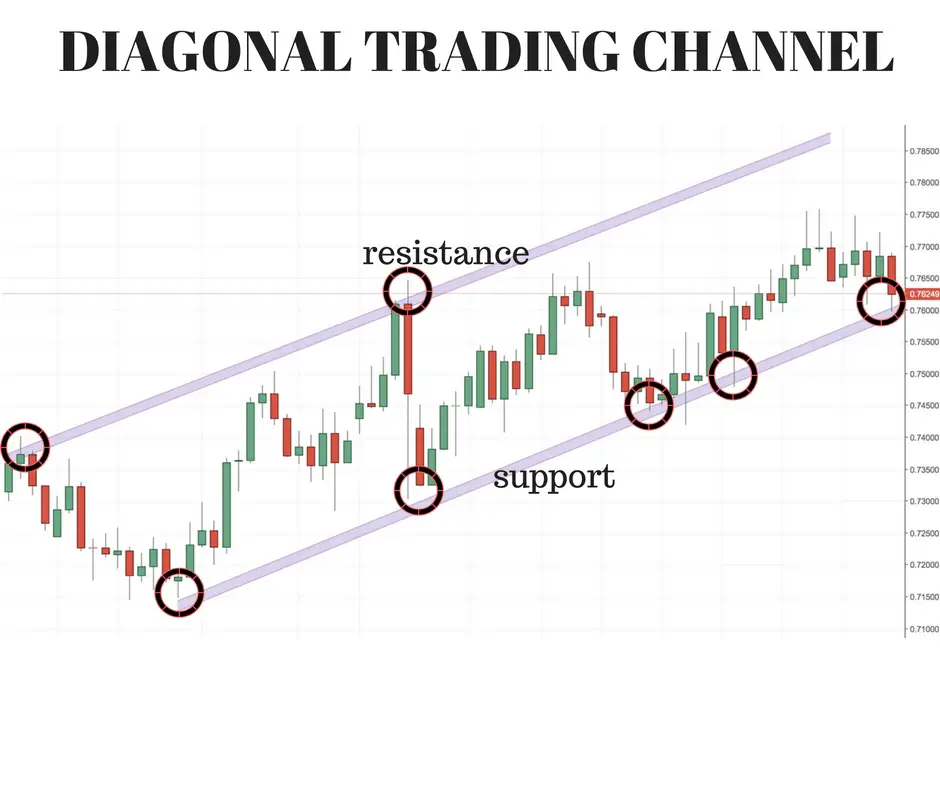
Here is an example of an up trending price channel:
차트 요약: 트렌드 라인은 차트의 수직 또는 수평 지지대 및 저항을 연결하여 차트의 추세를 측정, 식별 및 추적하는 시각적 방법이다.
가격 채널은 상승, 하강 또는 측면일 수 있다.
업트렌드, 다운트렌드, 레인지 바운딩 가격 채널이 있다.
다음은 상승추세를 그리고 범위제한 가격 채널의 예:
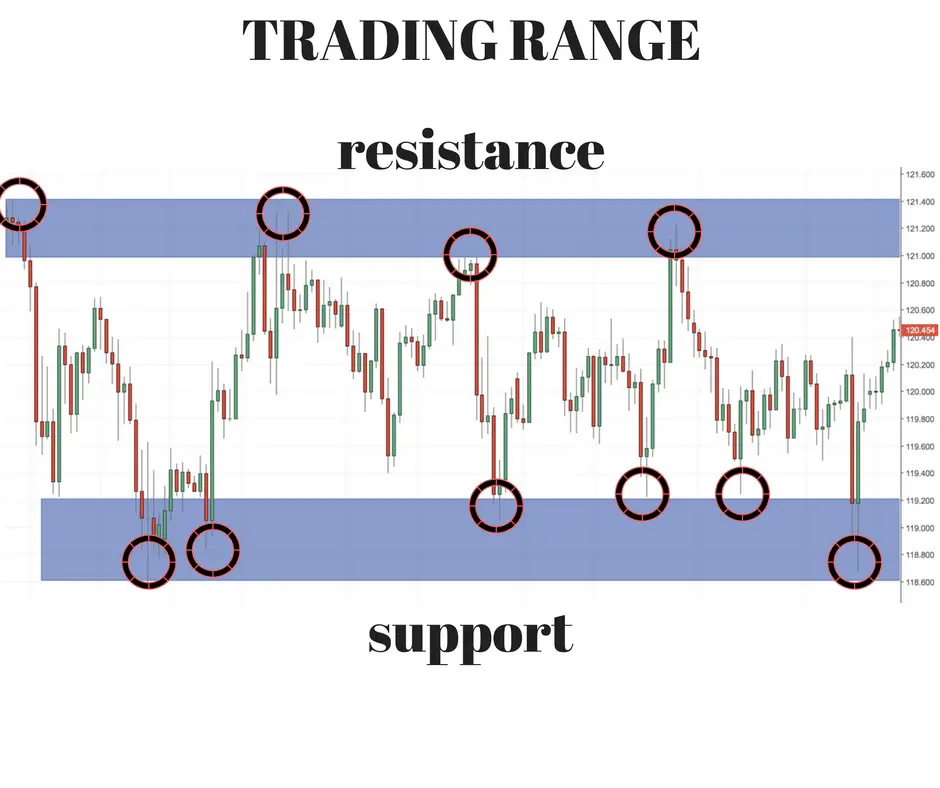
Here is what a range bound trading channel looks like:(범위제한 거래채널 모습)
Many times after a break out of resistance, old resistance can become new support: (Or vice versa).
저항에서 이탈한 후 많은 경우, 오래된 저항은 새로운 지지대가 될 수 있다: (혹은 그 반대가 될 수 있다.)
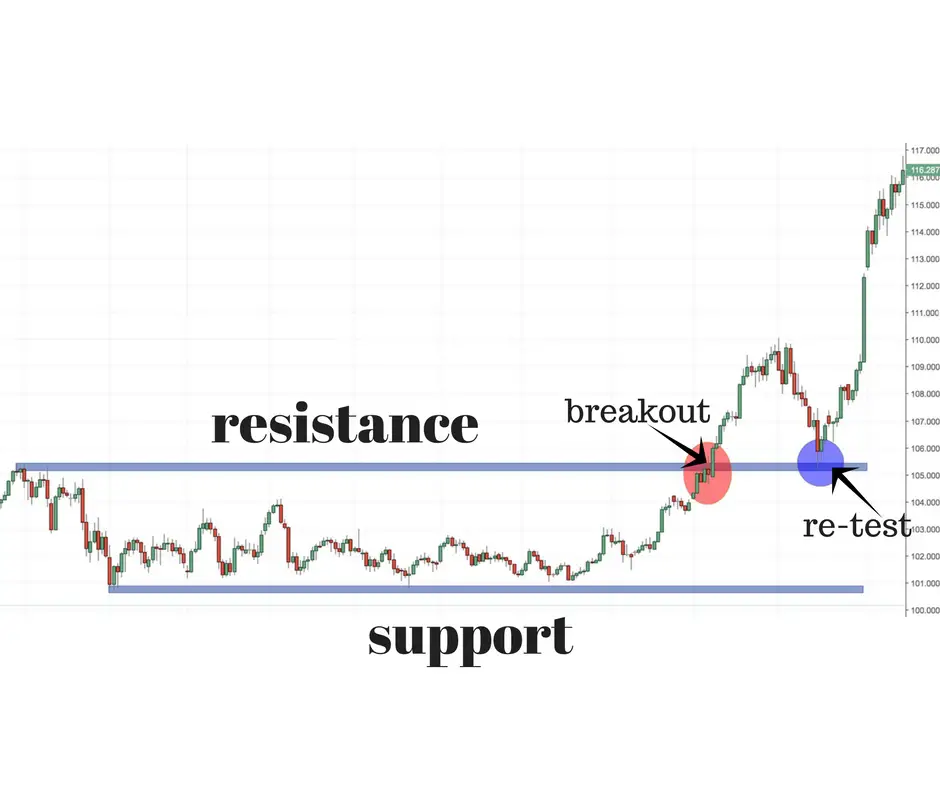
Chart Facts:
A trading channel can be vertical or horizontal and is defined by trend lines.
거래 채널은 수직 또는 수평일 수 있으며 추세선으로 정의된다.
Vertical ascending up trend channels is defined by parallel higher highs and higher lows.
수직 상승 추세 채널은 병렬적으로 높은 고도와 높은 저도에 의해 정의된다.
- Vertical down trend channels are defined by parallel lower highs and lower lows.
수직 하향 추세 채널은 평행한 낮은 고점과 낮은 하한으로 정의된다.
- Horizontal descending trend lines are defined by parallel lines that have price resistance around the same area of a high price level and price support around a similar lower area of price.
수평 내림 추세선은 높은 가격수준의 동일한 면적 주위의 가격저지와 유사한 낮은 가격대의 가격지지가 있는 평행선으로 정의된다.
- Resistance lines in a chart pattern is where buyers are absent at higher prices and selling pressure at those prices set in.
차트 패턴의 저항선은 높은 가격으로 구매자가 부재하고 설정된 가격에사 판매 압력을 가하는 곳에 존재하는 것이다
- Support lines in a chart pattern are where buyers step in to buy at a price level to prevent prices from going lower overcoming the selling pressure.
도표 패턴의 지원 라인은 판매 압력을 극복하는 가격이 낮아지는 것을 방지할 가격 수준에서 구매자가 구매하는 곳에서 존재하는 것이다.
- Buyers and sellers are always equal in any trade the variance is in what price that the trade will take place.
매입자와 판매자는 어떤 거래에서든 항상 동일하다. 매매의 가격 변동은 거래가 형성되는 가격에서 일어난다
- Many times when a horizontal price channel is broken higher the old resistance becomes the new support.
수평 가격 채널이 더 높게 파손되는 경우가 많으며, 기존의 높은 저항은 새로운 지원이 된다.
- Many times when a horizontal price channel is broken lower the old support becomes the new resistance.
수평적 가격 채널이 파손될 경우 기존의 낮은 지원은 새로운 저항이 된다
- Channels are for identifying where buyers and sellers are located.
채널은 구매자와 판매자가 위치하고 있는 곳을 식별하기 위하여 존재한다
- Momentum and trend signals are given when a well defined price channel is broken.
정확한 가격 채널이 고장 났을 때 모멘텀 및 트렌드 신호가 주어진다
- Another name for a horizontal price chart pattern is a rectangle. The break out of the range in either direction is the signal to enter a trade in the direction of the break.
수평형 가격표 패턴의 또 다른 이름은 직사각형이다. 어느 방향에서든 그 범위로부터의 이탈은 단절의 방향으로 무역에 들어가기 위한 신호다.
This $SMH chart shows examples of three ascending channels during the uptrend in this chart. The lower trend lines held up well in real time tracking and connecting on this chart. The upper trend line continued to set higher highs which was bullish. You also want to see the lower ascending support line continue to set higher lows by the close each day to keep reconnecting your lower trend line for ascending support.
이 $ SMH 차트는 이 차트에서 상승 추세 동안 3 개의 오름차순 채널의 예를 보여줍니다. 낮은 추세선은 이 차트에서 실시간 추적 및 연결에서 잘 유지되었습니다. 상위 추세선은 계속해서 상승장인 높은 고점을 설정한다 . 또한 낮은 오름차순의 지원이 을 위해 하한 추세선을 계속 다시 연결하기 위해 하한 상승 지원 라인이 매일 닫힘까지 계속 높게 설정되는 것을 보고자 함
.
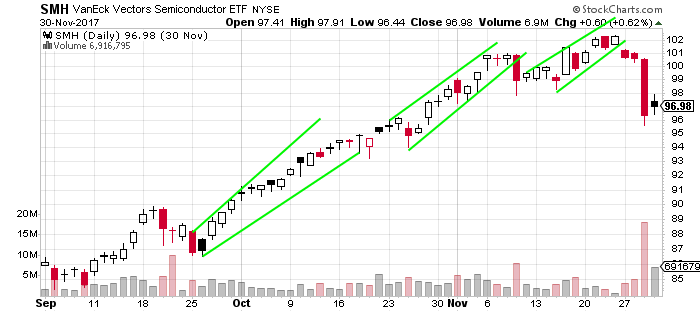
Chart Courtesy of StockCharts.com
This $PSX chart is an example of a reoccurring horizontal price channel for months. This is an example of a range bound market. The resistance is near $78.50 and support is near $74.50 to create a trading range. Notice that breakouts above and below these levels failed over and over. Returning to the previous price range after a failed break out is a sign of a range bound market. Trending market should have continuation after a break out is attempted several times. The best way to look for patterns of support and resistance is to look at where highs and lows of prices went to the last few times it made short term lows and highs in price.
StockCharts.com 차트 커티시
이 $PSX 관리도는 수개월 동안 수평 가격 채널이 다시 발생하는 예다. 이것은 범위 제한 시장의 한 예다. 저항은 78.50달러, 지원은 74.50달러에 육박해 거래범위를 형성하고 있다. 이러한 수준 이상과 이하의 브레이크아웃은 반복적으로 실패했다는 점에 유의하십시오. 고장 난 후 이전 가격대로 복귀하는 것은 범위 제한 시장의 신호탄이다. 트렌딩 시장은 여러 차례 브레이크아웃을 시도한 후에도 지속되어야 한다. 지지와 저항의 패턴을 찾는 가장 좋은 방법은 단기간 동안 최저가와 최고가를 기록했던 지난 몇 차례 물가 상승과 최저가 어디로 갔는지 살펴보는 것이다.

Chart Courtesy of StockCharts.com
Chart Summary:
- In defined vertical price channels there are better odds of success in buying the direction of the channel.
- When trend lines connect higher highs and higher lows the best odds are on buying the dip in price to the lower trend line.
- When trend lines connect lower highs and lower lows the best odds are on selling rallies into the upper trend line.
- In horizontal price channels there are better odds of success in buying support and selling resistance.
StockCharts.com의 차트 제공
- 차트 요약 :
• 정의 된 수직 가격 채널에서는 채널 방향을 구매하는 데 성공할 확률이 더 높습니다.
• 추세선이 고점과 저점을 연결하면 가장 낮은 확률은 낮은 추세선으로 가격이 하락할 때 발생합니다.
• 추세선이 낮은 최고점과 낮은 최저점을 연결하면 가장 높은 가능성은 상단 추세선에 랠리를 판매 할 때 발생합니다.
수평적 가격 채널에서는 구매 지원 및 매도저항에서 성공 가능성이 더 높습니다


