“Trend followers use reactive(반응적) technical analysis. Instead of trying to predict a market direction, their strategy is to react to the market’s movements whenever they occur. This enables them to focus on the market’s actual moves and not get emotionally involved with trying to predict direction or duration.” -Michael Covel
트렌드 팔로워들은 반응적인 기술적 분석을 사용한다. 그들의 전략은 시장 방향을 예측하려고 하는 것이 아니라, 그것이 발생할 때마다 시장의 움직임에 반응하는 것이다. 이를 통해 그들은 시장의 실제 움직임에 초점을 맞출 수 있고 방향이나 기간을 예측하는 데 감정적으로 관여하지 않게 된다." -마이클 코벨
Trading a trend in price requires you to trade in the direction of the accumulation or distribution in a market. Higher highs signal accumulation and an uptrend while lower lows show distribution and a downtrend. What is a simple way to create your own trend trading strategy? The first step is to backtest the signals on your watchlist that you think would theoretically work to capture trends and also allow you to exit with profits when the trend bends. Trend trading signals have to get you in with price momentum and then tell you to lock in your open profits at the end when the trend bends.
가격 동향을 거래하려면 시장에서의 축적이나 분산 방향으로 거래해야 한다. 고저 신호 누적과 상승은 분산과 하락을 보여준다. 당신만의 트렌드 트레이딩 전략을 만드는 간단한 방법은 무엇인가? 첫 번째 단계는 이론적으로 트렌드를 포착하는 데 효과가 있을 것으로 생각되는 시계리스트의 신호를 백테스트하고 트렌드가 구부러질 때 수익으로 종료할 수 있도록 하는 것이다. 트렌드 트레이딩 신호는 가격 모멘텀에 따라 당신을 끌어들여야 하고, 그리고 그 추세가 꺾일 때 마지막에 당신의 공개 이익을 잠궈야 한다고 말해야 한다.
One of the most simple trend trading strategies is to combine moving averages into a crossover system. You go long when a faster moving average of a shorter time frame crosses over a slower moving average of a longer time period. You use your short term moving average as a signaling line over the slower one. A crossover signal helps filter a lot of the price volatility around single moving averages and avoid a lot of the false signals so you have less losses and trade less.
가장 간단한 추세 거래 전략 중 하나는 이동 평균을 교차 시스템으로 결합하는 것이다. 더 짧은 시간틀의 더 빠른 이동 평균이 더 긴 시간의 느린 이동 평균에 걸쳐 교차할 때 당신은 오래 간다. 당신은 당신의 단기 이동 평균을 느린 것의 신호 선으로 사용한다. 교차 신호는 단일 이동 평균 주변의 많은 가격 변동성을 필터링하고 많은 거짓 신호를 피하는 데 도움이 되므로 손실이 적고 거래량을 적게 한다
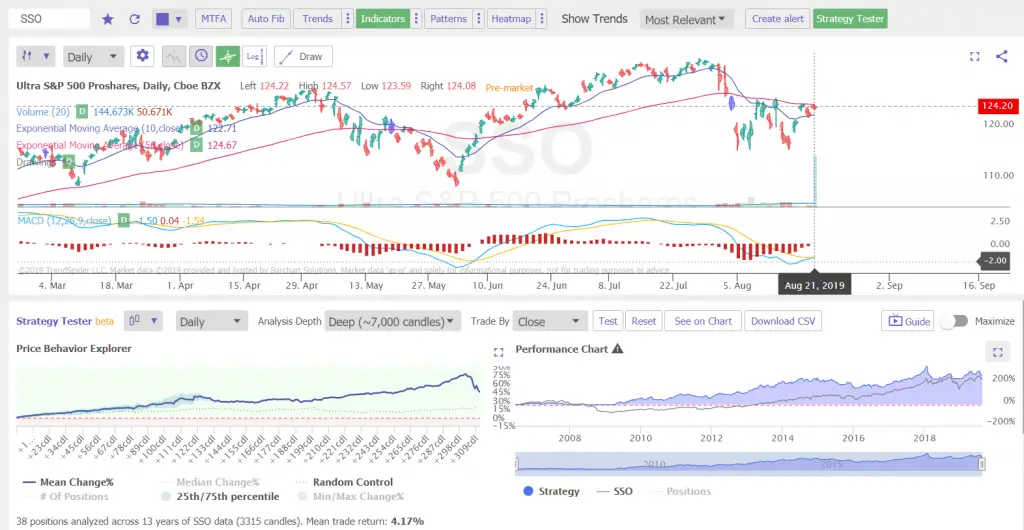
The following is an example of using the 10 day / 50 day exponential moving average crossover as an end of day trend trading signal on the $SSO chart using the Trend Spider Strategy Tester.
다음은 Trend Spider Strategy Tester를 사용하는 $SSO 차트에서 10일 / 50일 지수 이동 평균 교차 신호를 하루의 종료 추세 거래 신호로 사용한 예다.
This trend trading strategy signals to go long when the 10 day EMA crosses and closes over the 50 day EMA and to go back to cash when the 10 day EMA crosses under and closes below the 50 day EMA. This is a simple way to introduce the principles of trend following in a systematic way.
이러한 추세적 거래 전략은 10일의 EMA가 50일의 EMA를 통과하고 위에서 마감할 때 길게 가고, 10일의 EMA가 50일의 EMA 아래로 통과하여 밑에서 마감할 때 다시 현금으로 돌아가라는 신호다. 이것은 체계적으로 따르는 경향의 원리를 소개하는 간단한 방법이다.
You can see that the 10/50 day EMA backtest returned +275% versus(과 대비해서) buy and hold at +240% going back to 2007 for a positive mean return of +4.17% per trade. The big difference in the trend signal versus the buy and hold approach is the risk adjusted return. The $SSO ETF experienced a -84.7% drawdown during the financial crises that you can see from the below equity curve and stayed under water for a long time while the 10/50 day EMA signaled to be in cash. The 10/50 day EMA crossover strategy had only a -29.6% draw down even though it beat buy and hold.
당신은 10/50일의 EMA 백테스트에서 +275%의 매수와 +240%의 매수에 대해 +4.17%의 긍정적인 평균 수익률을 얻기 위해 2007년으로 돌아간 것을 볼 수 있다. 추세 신호와 매수 및 보유 접근방식의 큰 차이는 위험 조정 수익률이다. 달러화 ETF는 금융위기 동안 -84.7%의 하락을 경험했으며, 10/50일의 EMA가 현금으로 표시되는 동안 오랫동안 물속에 있었다. 10/50일의 EMA 크로스오버 전략은 매수 및 보유를 앞섰음에도 불구하고 -29.6%에 그쳤다..
The below chart is a zoomed(급상승하다) in view of the current signals and below is a comparison of the equity curves of the crossover signal versus buy and hold on the $SSO chart.
아래 차트는 현재 신호를 확대해서 표시한 것이며, 아래는 교차 신호의 지분 곡선과 $SSO 차트의 매입 및 보유를 비교한 것이다.
To create you own trend trading strategies you need to backtest your watch list across(걸처서) multiple moving average signals to see which ones would have captured trends in the past and create a good probability of catching trends in the present and future.
당신 자신의 트렌드 트레이딩 전략을 만들려면 당신은 과거에 어떤 것이 트렌드를 포착했는지 확인하기 위해 여러 이동 평균 신호에 걸쳐 시계 목록을 다시 테스트해야 하며 현재와 미래의 추세를 잡을 수 있는 좋은 확률을 만들어야 한다.

