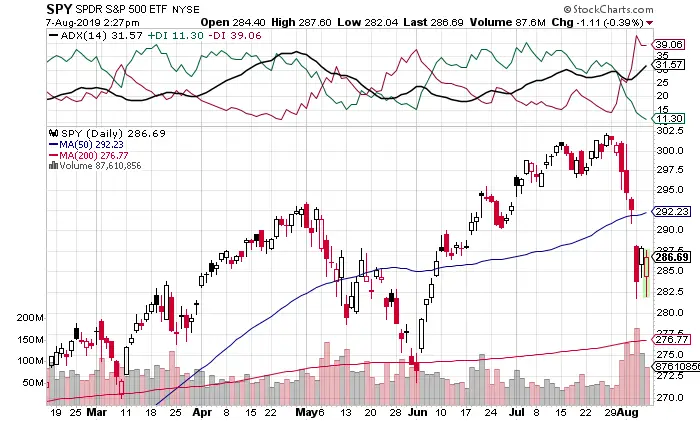
The Average Directional Index (ADX) is a technical indicator that uses the Minus Directional Indicator (-DI) and Plus Directional Indicator (+DI) to visually show a group of directional movement indicators that can be used as a trading system and was invented by Welles Wilder. Mr. Wilder created the ADX to focus on the daily prices of commodities this technical indicators can also be used in the stock market.
ADX (Average Directional Index)는 마이너스 방향 표시기 (-DI)와 플러스 방향 표시기 (+ DI)를 사용하여 거래 시스템으로 사용할 수 있는 Welles Wilder가 발명한 방향성 이동 표시기 그룹을 시각적으로 표시하는 기술 지표입니다. 웰스 와일더 Wilder는 ADX를 만들어 상품의 일일 가격에 중점을 두어이 기술 지표를 주식 시장에서도 사용할 수 있습니다.
Positive and negative directional movement is the foundation of the Directional Movement System. Wilder used the ADX to determine the direction of the movement by measuring the difference between two consecutive lows with the difference between their respective highs.
긍정적이고 부정적인 방향성 움직임은 방향성 움직임 시스템의 기초입니다. Wilder는 ADX를 사용하여 연속 된 두 개의 최저 차이와 각각의 최고 차이를 측정하여 이동 방향을 결정했습니다.
The Plus Directional Indicator (+DI) and Minus Directional Indicator (-DI) are derived from smoothed averages of these differences and measure the direction of a trend over time. These two indicators are often collectively referred to as the Directional Movement Indicator (DMI).
플러스 방향지시기(+DI)와 최소 방향지시기(-DI)는 이러한 차이의 평활화된 평균에서 도출하여 시간에 따른 추세의 방향을 측정한다. 이 두 지표를 흔히 총칭하여 방향 이동 지표(DMI)라고 한다.
The Average Directional Index (ADX) is derived from the smoothed averages of the difference between +DI and -DI; it measures how strong the trend is in either direction during the timeframe of the chart.
Using these three technical indicators together, swing and trend traders can use the ADX to see not only the direction, but also the strength of a trend.
평균 방향 지수(ADX)는 +DI와 -DI 사이의 차이의 평활화된 평균에서 도출되며, 차트의 기간 동안 어느 한 방향으로 트렌드가 얼마나 강한지를 측정한다.
이 세 가지 기술 지표를 함께 사용하면 스윙과 트렌드 트레이더들은 ADX를 사용하여 방향뿐만 아니라 트렌드의 강점도 볼 수 있다.
The creator Welles Wilder introduced the Directional Movement indicators in his 1978 book, New Concepts in Technical Trading Systems. Wilder’s techncial indicators are very detailed and complex in their calculations and are still great trading tools to this day.
창조자인 웰스 와일더는 1978년 그의 저서 "기술거래시스템에서의 새로운 개념"에서 방향 이동 지표를 소개했다. 와일더의 기술적 지표는 그들의 계산에 매우 상세하고 복잡하며 오늘날에도 여전히 훌륭한 거래기구이다.
It takes around 150 periods (주기)of data to get true ADX values based on Wilder’s smoother techniques. The Average Directional Index (ADX) is used as a tool to measure the power or weakness of a trend as it plays out(재생하다), not the direction of that trend. The direction of the movement is defined with the +DI and the-DI. The bulls usually have the advantage when the +DI is greater than the -DI, and the bears have the advantage when the -DI is greater. Crossovers of these directional indicator lines can be combined with the ADX for entry and exit signals for trades.
와일더의 매끄러운 기법에 근거해 진정한 ADX 값을 얻으려면 약 150주기의 데이터가 필요하다. 평균 방향 지수(ADX)는 해당 추세의 방향이 아니라 재생할 때 트렌드의 힘이나 약점을 측정하는 도구로 사용된다. 이동 방향은 +DI와-DI로 정의된다. 일반적으로 -DI보다 +DI가 클 때 황소가 유리하고 -DI가 클 때 곰이 유리하다. 이러한 방향 지시선의 교차점은 트레이드의 진입 및 종료 신호를 위해 ADX와 결합할 수 있다.
The Average Directional Index (ADX) can be used as a tool to signal if a market is in a trend or whether it is rangebound. This technical indicator and show traders whether they need to choose between trend following signals or swing trading signals on a chart. A strong trend is in place with the ADX over 25 and there is no current trend when the ADX is below 20. There is a neutral zone between 20 and 25. Traders can adjust the settings of the lines for faster or slower signals in their own timeframe. ADX has more lag time before signals of other indicators because of the smoothing techniques in its calculaitons. There are many technical analysts use 20 as a key level when they use the ADX on their charts.
평균 방향 지수 (ADX)는 시장이 추세에 있거나 범위에 있는지 여부를 알리는 도구로 사용될 수 있습니다. 이 기술 지표는 거래자에게 차트에서 추세 추종 신호 또는 변동 거래 신호 중에서 선택해야하는지 여부를 보여줍니다. ADX가 25를 초과하는 강력한 추세가 있으며 ADX가 20 미만일 때 현재 추세가 없습니다. 20과 25 사이의 중립 영역이 있습니다. 거래자는 자체적으로 더 빠르거나 느린 신호에 맞게 라인 설정을 조정할 수 있습니다. 기간. ADX는 계산법의 스무딩 기술로 인해 다른 지표의 신호보다 지연 시간이 더 깁니다. 차트에서 ADX를 사용할 때 많은 기술 분석가가 20을 키 레벨로 사용합니다.
